Introduction
CrimeStat is a crime mapping software to look at spatial distribution of crime incidents using spatial and statistical analysis. In our project, we will be computing various statistical method on crime Incident using CrimeStat. The study area is in Ottawa Nepean area between January 2005 to March 2006. The data is retrieved from the Ottawa Police Department and Statistics Canada. We looked at all spatial pattern of crime occurrence locations and to analyze them as point data using Geographic Information Systems. Crime incidents reveal different patterns, and it is our job to see if the activities show evidence of clustering; as well a possibility where an offender is committing crime activities repeatedly in the area. The time and intensity of crime activities also reveal evidence of being clustered in both time and space. The results of crime analysis is very useful in setting up measures to protect against crime activities, and pay special attention to those area with high criminal activities. Some other examples involve reforming neighborhoods, and forming policies that target against certain criminal activities.
Nearest Neighbor Index
The nearest neighbor index (NNI) tell us about characteristics of the distances between criminal activities. It is used for first order effects that are considered global because this statistical approach only reveal the dominant pattern of distribution by looking at how crime activities are centered, how far they spread out, and if it shows any sign of dispersion. But CrimeStat can construct K-order nearest neighbor indices which reveal more than first-order spatial randomness, and using different distances for each order. The mathematical explanation is that the nearest neighbor index is the ratio between nearest neighbor distance and random distance index. How they calculate nearest neighbor distance is by averaging the shortest distance of each point to another point for all criminal activities. If the observed average distance is smaller than the mean random distance, that is, points are actually closer together than would be expected on the basis of chance, then the nearest neighbor index will be less than 1.0. This is evidence for clustering and nearest neighbor index should be smaller to be considered more clustered, and dispersed if it is higher than 1.0.
Moran’s I Value
Another way to examine the spatial distribution of the crime incidents is to determine the spatial correlation between crime intensities within the dissemination areas. NNA looks at the pattern of crime location, but spatial autocorrelation especially Moran’s I statistics tells you whether incidents are correlated or not by looking at intensity of crimes. We will analyze the spatial autocorrelation between the intensity of crimes within each disseminations area, and those value of 0 are not autocorrelated and values closer to 1 are autocorrelated. Since Moran’s I statistics is a global number, but Moran Correlogram which calculated the I value by different distance interval reveal to us about local Moran’s I index.
The Knox Index
The Knox index helps us determine the relationship between space and time. We will be working with car theft data because those data include their time of crime. To be precise, we know that crime incident sometime tend to clustered together during a short time periods in other words crime activities could cluster within time as well. Knox Index is one of the four space time technique available in CrimeStat, and it is our job to see which type of space-time relationship is determined for our data. Knox Index will analyze distance variable and time interval between each individual crime event, and set up a 2 x 2 matrix table corresponding to all data’s to see if they are close in space and close in time.
Kernel Density Estimation
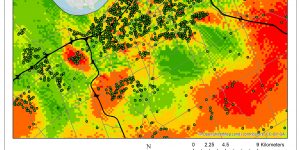
Kernel Density is a skill used in Interpolation to generalize incident locations to an entire area, and that is based on hot spot statistics such a fuzzy mode including summaries for the data incident themselves will become interpolated. In a sense, it provide a crime density estimation for all parts of Ottawa Nepean with data about crime intensity variable. Kernel analysis looks at an entire area to compute statistically clustering location while fuzzy analysis and hot spot look at each point individually.
Kernel density analysis is a good way to visualize cluster and tells you the chance of a break and enter crime occurring at those location among cluster. The dual kernel density takes in consideration of risk adjusted for population difference in each area while single kernel density does not. From examining (Map 3) below for dual kernel density, I see that single kernel density is more misleading implying more crime than dual kernel density; since it doesn’t consider population size. The two map is very different at the bottom right corner where Map 3 highlight a significant risk in the center area, because it is adjusted for the population there at those neighborhood which results in the portrayal of risk over in those region.
Conclusion
This report gave a analysis on Crime Analysis by using CrimeStat with statistics method performed in Space-Time Analysis (knox Index), Nearest Neighborhood Analysis (Spatial analysis), Fuzzy Mode (Cluster analysis), and Kernel Density (Interpolation analysis). The introduction of crime pattern can reveal information of criminal activities in accordance for people to know how to migrate danger and risk in the future.